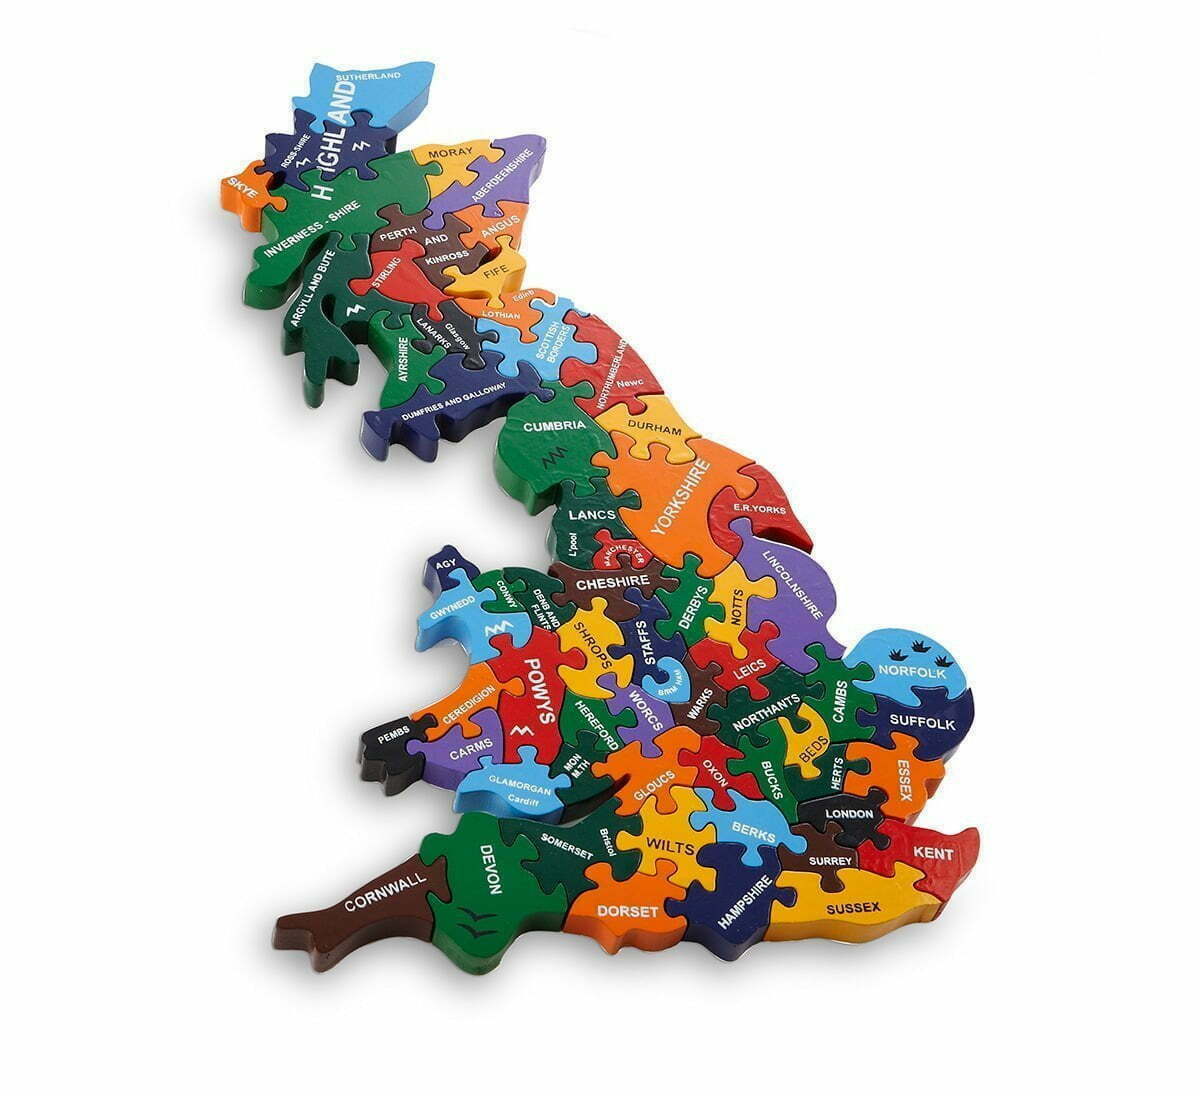
How to make shape maps in Power BI for the UK (or anywhere)
Out of the box, Power BI seems to offer a pretty good selection of map visuals… until you try and apply them to the UK. Power BI sort-of recognises UK postcodes, but it’s no good with counties. Anyone who starts trying to visualise the geography of the UK in Power BI will soon realise they need to do a bit of work.
For shape maps that can slice up the UK (or anywhere else in the world) an out-of-the-box visual needs to be activated by going to File > Options > Preview Features and clicking “Shape map visual”. This will now appear in the visual pane like this:

Click on the visual and click Format > Map Settings and change the map type to “UK:countries” and it will look like this:
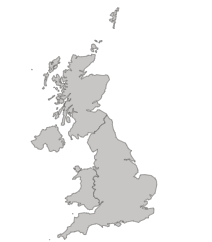
If this level of detail is all that is required then just put the country field (Northern Ireland, Scotland, England, Wales) into the Location bucket and your chosen measure in the Colour saturation bucket.
However I want to split the UK into broad regions like this:
- Northern Ireland
- Scotland
- Wales
- North West England
- North East England
- Yorkshire and the Humber
- West Midlands
- East Midlands
- East of England
- South West England
- Greater London
- South East England
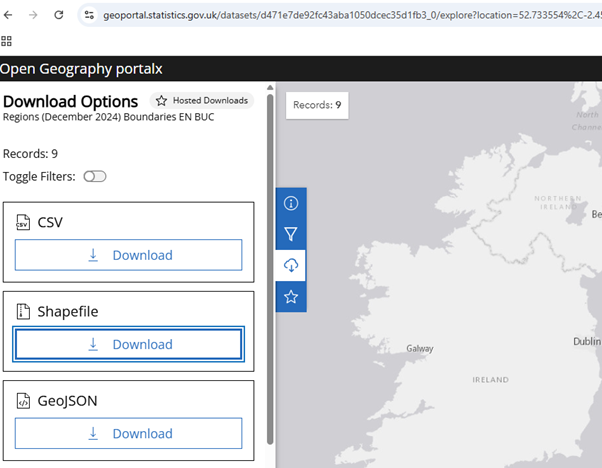
Go to https://geoportal.statistics.gov.uk/
Select Boundaries > OECD / Eurostat boundaries > NUTS 1
This is the first in the list and looks okay:
Click Download and Shapefile:
In order to work with Power BI the shapefile needs to be converted to a TopoJSON file.
Go to https://mapshaper.org/
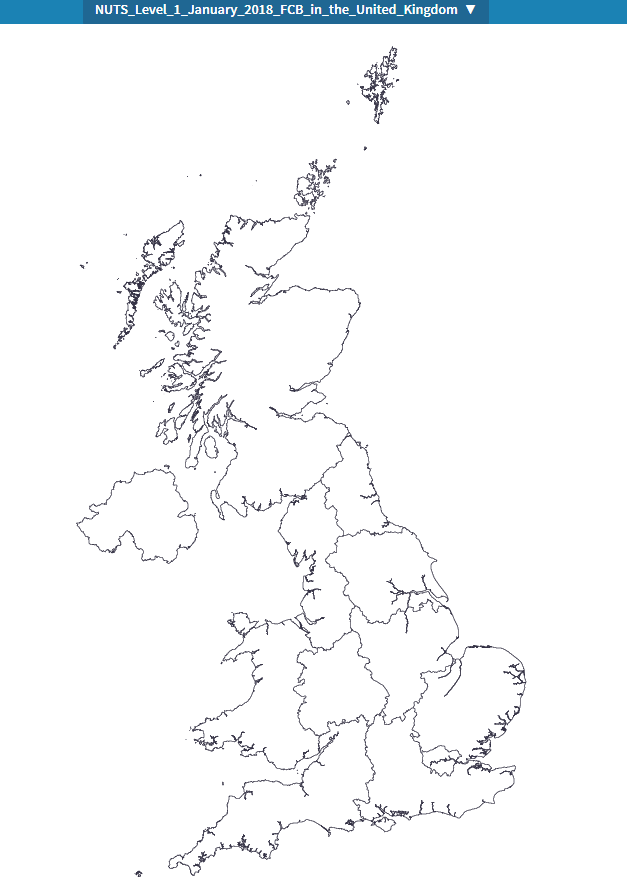
Click on Select and choose the zip download from geoportal.statistics.gov.uk
It will look like this:
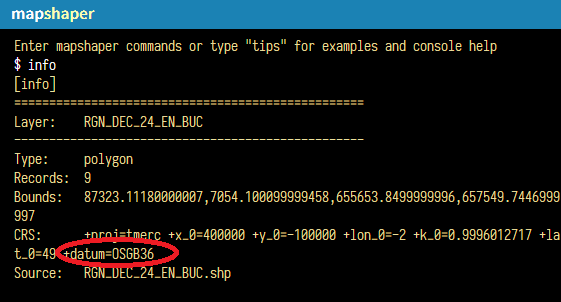
The shapefile from geoportal.statistics.gov.uk uses OSGB36 projection. In order to work with Power BI this needs to be converted to WGS84 (World Geodetic System) projection.
Click Console in mapshaper
Type “info” to confirm the projection is OSGB36:
Type proj wgs84. It will look slightly odd:
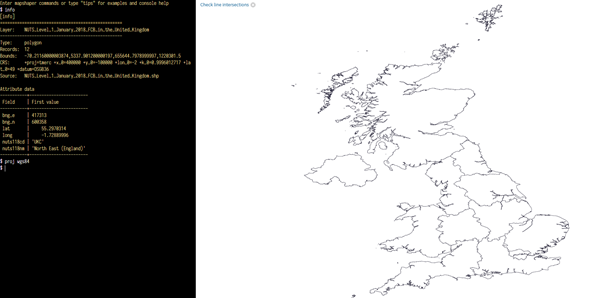
Click Export and choose TopoJSON as the file format.
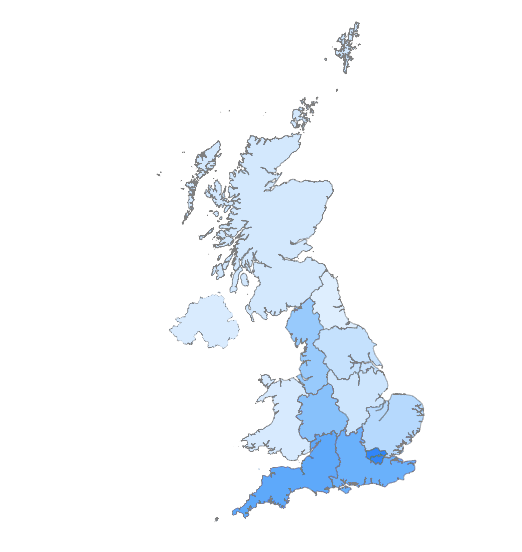
Back in Power BI, go back to the shape map visual and change the map settings to Custom map and upload the TopoJSON file you downloaded.
Put a UK Region field in the Location bucket and adject the Fill Colours format to appropriately show the gradations from light to dark (this will depend on the range of values for the measure). It will look like this:
There is a huge range of maps available on https://geoportal.statistics.gov.uk/ to split the UK into a shapemap, but this is a great one to start with.
My thanks to https://datawise.london/ and https://geoportal.statistics.gov.uk/ for their wonderful mapping recourses.
Leave a Reply