
This is very easy in Power BI, however it is not so obvious in Report Builder and a lot of online tutorials send you down the garden path.
Some will tell you to do the Top N filter on the dataset. However this presents problems:
- You might not have access to the SQL server and so be limited in the queries you can use.
- Your query might not be aggregated and it you try and apply an aggregate filter to the dataset (eg SUM(sales) Top N= 10), Report Builder will error telling you aggregate filters are not allowed.
- Even if you can filter the dataset, you might not want to because you need the non-filtered data in another visual or table.
To filter Top N on a chart, click the chart, then in the little Chart Data box select the category (the thing you are grouping by) and click Category Group Properties:
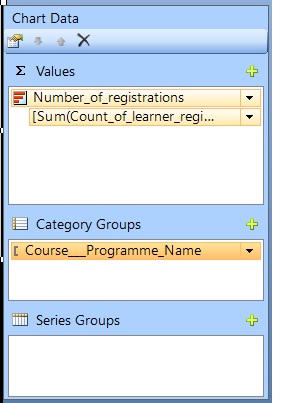
It is here that you can add the Top N filter on the chart:
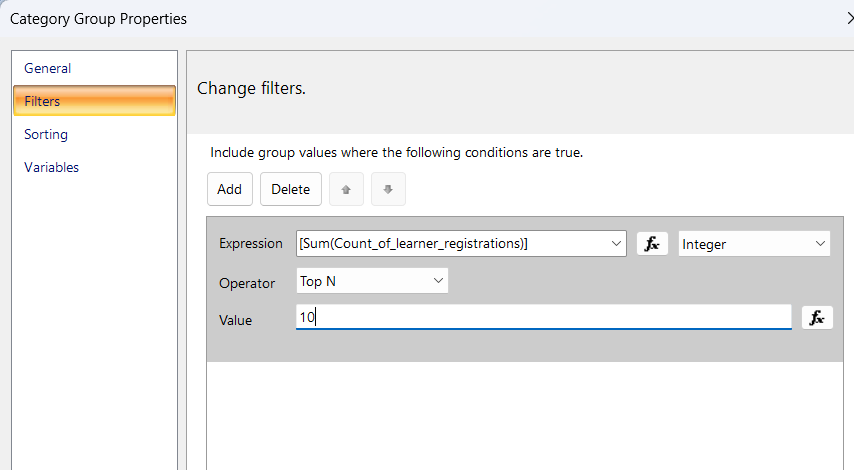
This is also the place to do sorting on the chart.
Leave a Reply